midop
Macroseismic Intensity Data Online Publisher
Macroseismic Intensity Data Online Publisher


MDP map
This settings page let you customize the appearance and functionalities of the intensity map. You can specify the default view zoom and extension, the geographical layers to be included and the available tools for the final user. The following settings boxes are available:
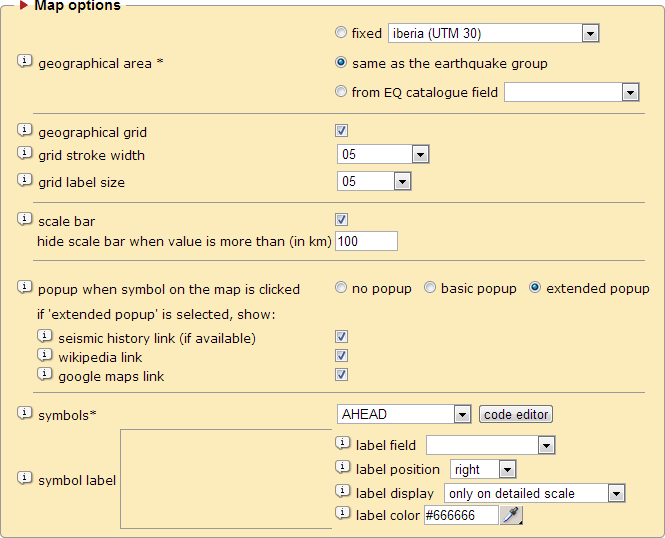
Geographical area
|
Select the geographical area where the earthquakes are placed. You can put all the earthquakes in a single area, inherit the group geographical area selection (specified in control panel page “EQ map”) or select a field in the catalogue table where a different geographical area has been specified for each earthquake. Here a compleate list of supported geographical areas. |
| Geographical grid | If selected, maps will be created with the geographical grid layer (graticule lines 1° by 1°). |
| Grid stroke width | Set the stroke width of the geographical graticule. |
| Grid label size | Set the character size of the labels with the geographical graticule values. |
| Scale bar | If selected, a graphical scale will be available to the user in the lower part of the map. Units are expressed in kilometers. You can specify at which distance the scale bar should disappear. |
| Print tool | If selected, the print tool will be available to the user with the icon “ ” in the map frame toolbox. ” in the map frame toolbox. |
| Symbols | Select which set of symbols must be used for representing observed macroseismic intensities. By clicking 'edit' the administrator can modify the PHP/SVG file containing symbols for each set. |
| Symbol label | Set if and which label should appear beside each MDP symbols. All fields contained in the MDP table can be selected. |
| Popup window if user clicks on a place |
If “alert” or “extended” are selected, every intensity symbol rendered on the map can be clicked by the user. If “alert” only a simple system alert will appear with the place name and the intensity value, if “extended” a popup window will appear with information such as place name, the geographical coordinates and some other information (see below). |
| Seismic history link (if available) |
If selected the link to the selected place seismic history will appear within the selected place popup window.. If clicked a new window will open. The link will only appear if the place satisfy the minimum number of earthquakes occurred specified in the “query by place” settings page. |
| Wikipedia link | If selected the link to the Wikipedia page about the selected place will appear within the place popup window. |
| Google maps link | If selected the link to Google map showing the place surroundings will appear within the place popup window. |
| Symbols | Select which set of symbols must be used for representing observed macroseismic intensities. By clicking 'edit' the administrator can modify the PHP/SVG file containing symbols for each set. |
| Symbol label | Set if and which label should appear beside each MDP symbols. All fields contained in the MDP table can be selected. |
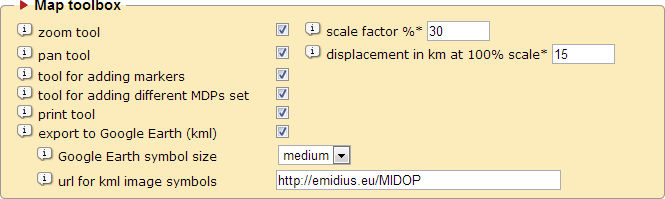
| Zoom tool | If selected, the zooming tool will be available to the user with the icon “  ” (zoom in) and “ ” (zoom in) and “  ” (zoom out) in the map frame toolbox. ” (zoom out) in the map frame toolbox. |
|
Define the scale step factor to be used with the zoom tool; the lower is this percentage, the lower will be the different scale factor between each click. |
| Pan tool | If selected, the pan tool will be available to the user with the icon “ ” in the map frame toolbox and users will be able to pan the map. ” in the map frame toolbox and users will be able to pan the map. |
|
Define the displacement steps to be used with the pan tool. |
| Tool for adding markers | If selected, the tool for adding new markers on the map will be visible in the map frame toolbox. End users will be able to add a -temporary- marker over the selected earthquake map by entering the coordinates. |
| Tool for adding different MDP set | If set, users can superimpose multiple earthquake intensity set on the same map. Only intensity sets published within the same website can be loaded. |
| Export to Google Earth | If selected, the icon “  ” will be available to the user and will let to see the selected map in Google Earth. End users must have Google Earth previously installed on their system. ” will be available to the user and will let to see the selected map in Google Earth. End users must have Google Earth previously installed on their system. |
| URL for image symbols | Set the absolute site URL that will be used while generating Google Earth .kml files (MDP symbols and the legend images). Usually it is set as "http://emidius.eu/MIDOP". |
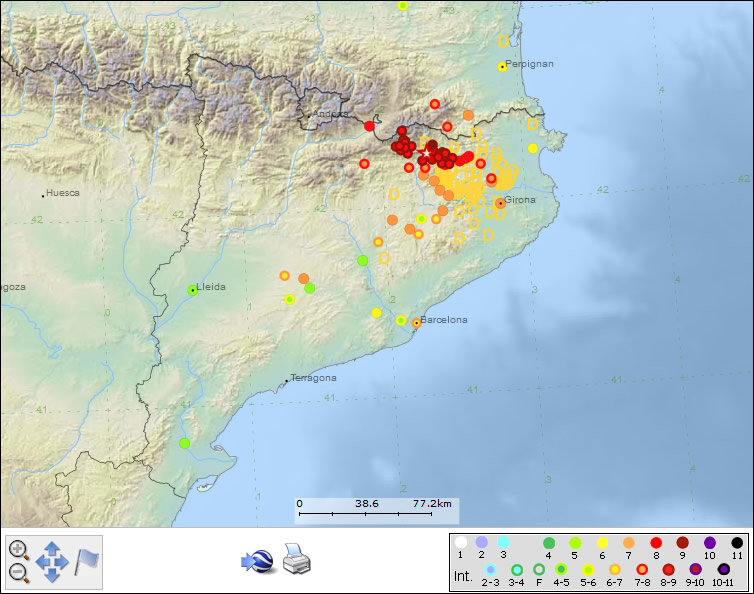
Example of an earthquake as it appears in MIDOP
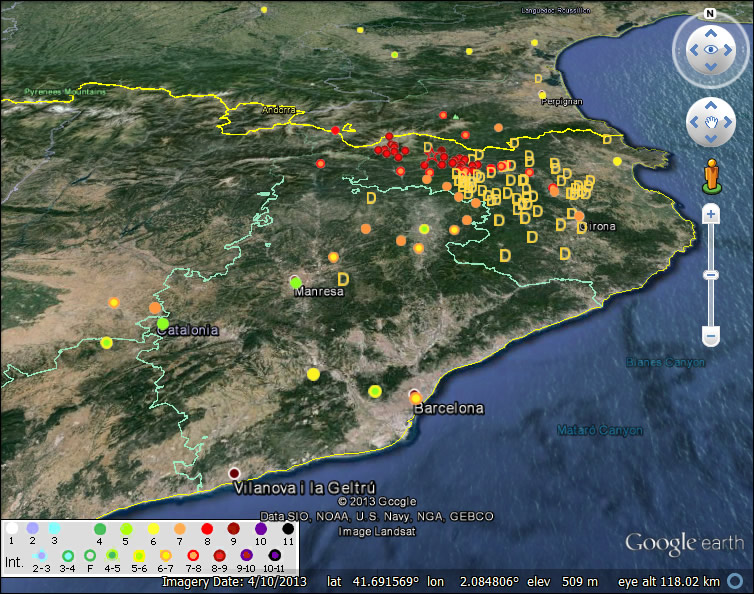
The same earthquake as it appears when exported to Google Earth
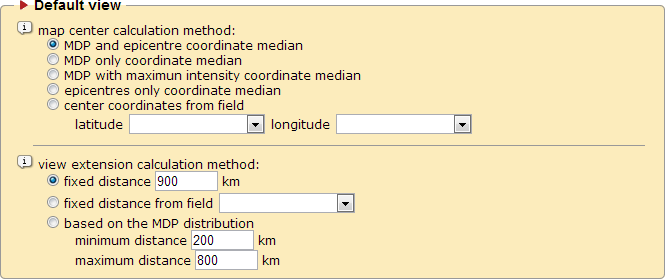
| Map center based on | Define how the default center of the map will be calculated. |
|
Define the map center to the coordinates resulting from the median between plotted epicentres and all the intensity points. |
|
Define the map center to the coordinate median resulting from all the plotted intensity points plotted. Only places corresponding to large areas (tab. 2c) that have coordinates will be used within the calculation. |
|
Define the map center to the coordinate median of the highest intensity value points plotted. |
|
Define the map center to the epicentre; only in case of more than one epicentre, the center will be set to the coordinate median resulting from all the plotted epicentres. |
|
Define the map center to coordinates taken from the earthquake catalogue table. |
| View extension | Define how the default view extension of the map will be calculated. |
|
Define the view extent to a fixed value valid for every earthquake map. |
|
Define the view extent from a value taken from the earthquake catalogue table field. Each earthquake can have a different value. |
|
Define the view extent automatically. The extent will be calculated taking into account all the intensity points of the earthquake. |
|
Limit the minimum value in kilometers of the automatic extent calculation. It useful in case the earthquake has a very small amount of points or they are very close to each other. |
|
Limit the maximum value in kilometers of the automatic extent calculation. It is useful in those earthquakes that cover very large geographical areas. |
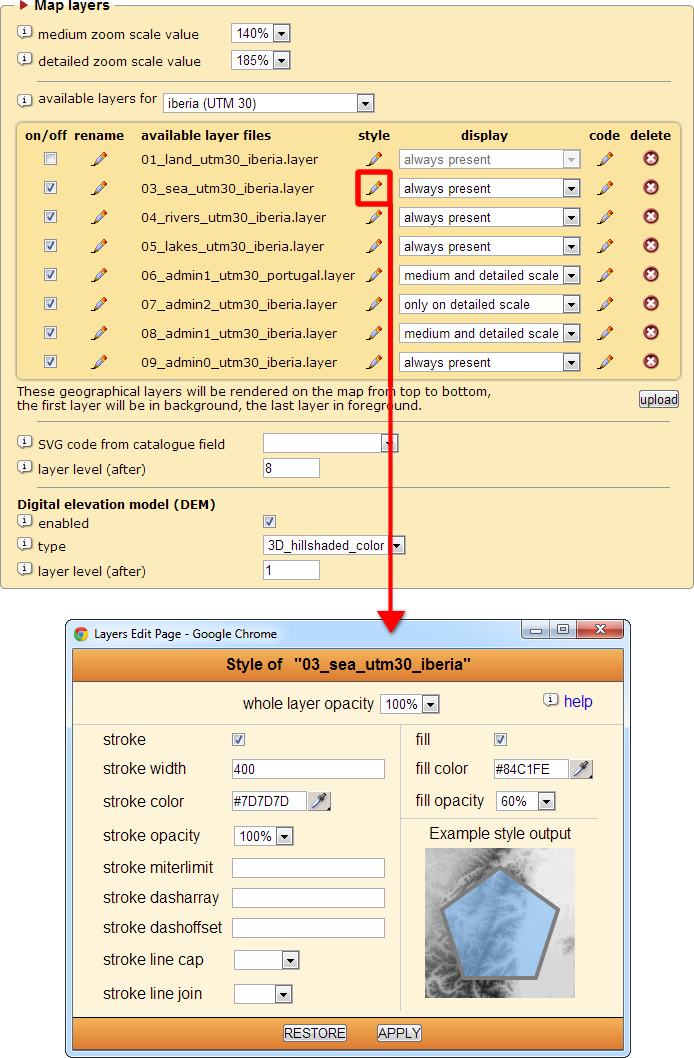
| Medium zoom scale value | Set the meaning of “medium” zoom in terms of zoom degree. |
| Detailed zoom scale value | Set the meaning of “detailed” zoom in terms of zoom degree. |
| Available layers for [covered area] | Manage which layers must be included with the generated maps. Built-in layers covers the following UTM zones: 28, ‘atlantic_islands’; 30, area 'iberia' or 'uk';31, area 'france';32, area 'italy';33, area 'eastern_europe' or ‘fennoscandia’;34, area 'aegean'. For further information on layers managements see chapter “Advanced customization”. |
|
Switch on or off the layer use when creating an earthquake map |
|
Rename the layer file name (the extension “.layer” must be kept) |
|
Layer file name (files stored in “data / layers_eq / [UTM] / [covered area]”). The level number at which the layer will be inserted within the map is automatically established by sorting the list of layer filenames alphabetically. |
|
Change the layer’s appearance style. A popup window will appear (see the image above) where you can specify both fill and stroke and the layer opacity. |
|
Set when the layer will be shown: always present, shown at medium and detailed zoom, only on detailed zoom |
|
Edit the layer source code. |
|
Delete the layer file (a requester will prevent accidental deletion) |
|
Load an additional layer file to MIDOP. |
| SVG code from catalogue field | Set which catalogue field contains SVG objects that will be rendered on the map. See the chapter 5.5. |
| Layer level | Set at which layer level the SVG code loaded from the catalogue field will be rendered. |
| Digital elevation model | MIDOP can include a DEM (Digital Elevation Model) when creating a map. |
|
Switch on or off the DEM inclusion when generating a map. |
|
Set the type of pre-elaborated DEM to be included: flat shaded (2D) or hill shaded (3D) |
|
Set the layer level where the DEM will be drawn in the map. |
Available layer style settings (details for SVG tags are available at http://www.w3.org/TR/SVG/painting.html):
| Layer opacity | Define the level of opacity (or transparence) of the geographical layer. |
| Stroke | If enabled, the geographical layer content will be drawn with a stroke. |
| Stroke width | |
| Stroke color | Specify the stroke color expressed in hex triplet (a six-digit, three-byte hexadecimal number used in HTML, CSS, SVG). |
| Stroke opacity | Define the level of opacity (or transparence) of the fill color of the stroke. |
| Stroke miter limit | Define the stroke miter limit. |
| Stroke dash array | Define the stroke dash array. |
| Stroke dash offset | Define the stroke dash offset. |
| Stroke line cap | Define the stroke line cap. |
| Stroke line join | Define the stroke line join |
| Fill | If enabled, the geographical layer content will be drawn with a fill. |
| Fill color | Specify the fill color expressed in hex triplet (a six-digit, three-byte hexadecimal number used in HTML, CSS, SVG). |
| Fill opacity | Define the level of opacity (or transparence) of the fill color of the layer. |
IMPORTANT NOTE ABOUT GEOGRAPHICAL LAYERS
Geographical layers are shared between all the websites managed by MIDOP. Renaming layers or deleting them will affect all the websites stored in MIDOP.
Geographical layers are shared between all the websites managed by MIDOP. Renaming layers or deleting them will affect all the websites stored in MIDOP.
Example of a flat shaded DEM.
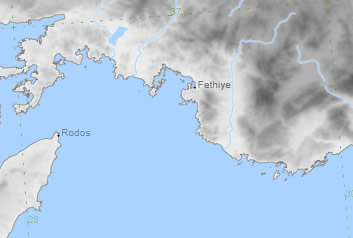
Example of a hill shaded DEM in black and white.
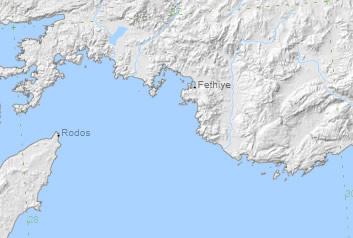
Example of a color hill shaded DEM.
IMPORTANT NOTE ON DEM USAGE
If you enable the DEM image inclusion within the generated maps, MIDOP uses PHP functionalities for image manipulation (GD image libraries, usually built-in in the PHP distribution). These procedures require a lot of computational power, both in terms of used RAM memory and CPU cycles. Generation is not in real time, and several seconds will be required; once the map is generated it will be cached and the next time it will ready instantaneously. To flush pre-generated maps stored within the MIDOP cache, simply click the “flush cache” button. Cached map files are stored within the folder “data / svg / maps”. Please, remember that the higher the quality of the DEM is, the heavier (and slower) the map will be in the client browser.
If you enable the DEM image inclusion within the generated maps, MIDOP uses PHP functionalities for image manipulation (GD image libraries, usually built-in in the PHP distribution). These procedures require a lot of computational power, both in terms of used RAM memory and CPU cycles. Generation is not in real time, and several seconds will be required; once the map is generated it will be cached and the next time it will ready instantaneously. To flush pre-generated maps stored within the MIDOP cache, simply click the “flush cache” button. Cached map files are stored within the folder “data / svg / maps”. Please, remember that the higher the quality of the DEM is, the heavier (and slower) the map will be in the client browser.
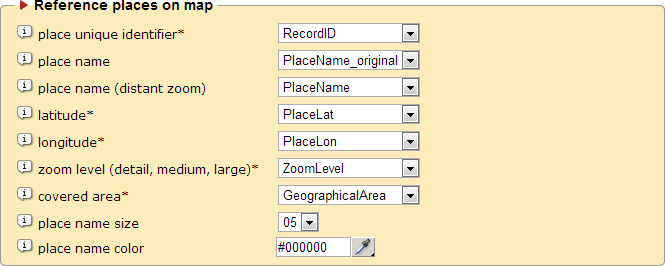
| Record unique identifier | Record unique identifier, not repeated in the table. |
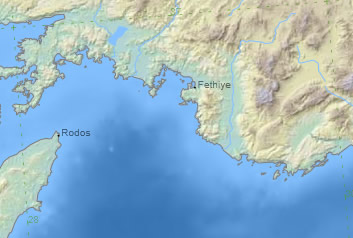
| Place name | Set the place name that will be plotted as a geographical reference on the map. |
| Place name (distant zoom) | Set the truncated place name that will be plotted as a geographical reference on the map with a distant zoom. |
| Latitude | Set the reference place latitude. The value must be expressed in geographical decimal degree. |
| Longitude | Set the reference place longitude. The value must be expressed in geographical decimal degree. |
| Zoom level (detail, medium, large) |
Set the zoom value to be used for the place name. Allowed values are: detail, for close up zoom; medium, for medium distant view; large, for distant zoom. |
| Covered area | Set in which geographical area the place will be shown. MIDOP has 6 built-in areas: “atlantic_islands”, “iberia”, “france”, “uk”, “Italy”, “eastern_europe”, “fennoscandia”, “aegean”. |
| Place name size | Set the size of the place names text plotted as a reference on the map. |
| Place name color | Set the color of the place names text plotted as a reference on the map. |
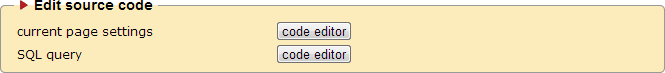
| HTML page | Edit the source code of the frame containing the map. |
| SQL query | Edit the source code of the MySQL query used for retrieving MDPs. |
| Current page settings | Edit the source code of the settings contained in this control panel page. |
IMPORTANT NOTE
Changing the source code directly might completely harm MIDOP and it might end up stop working.
You should know what you are doing and please, use these funcionalities with extreme care.
Changing the source code directly might completely harm MIDOP and it might end up stop working.
You should know what you are doing and please, use these funcionalities with extreme care.
