midop
Macroseismic Intensity Data Online Publisher
Macroseismic Intensity Data Online Publisher


Earthquakes map
This page let you customize the appearance of the map representing all the earthquakes listed in the selected earthquake catalogue list.
The following settings boxes are available:
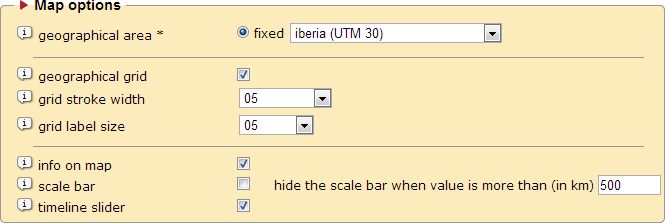
Geographical area
|
Select the geographical area where the earthquakes listed in the earthquake catalogue list are referred to. If you created more than one sub-sets of earthquake groups you can specify a geographical area for each group. Here a compleate list of supported geographical areas. |
| Scale bar | If selected, a graphical scale will be available to the user in the lower part of the map. The units of measurements are expressed in kilometers. |
|
Set the scale maximum value; after this value the scale bar will not be shown. |
| Geographical grid | If selected, a latitude and longitude geographical grid will be rendered on the map. |
| Grid stroke width | Line width of the rendered geographical grid, from 1 (small) to 10 (large). |
| Grid label size | Font size of the geographical grid labels, from 1 (small) to 10 (large). |
| Info on map | If selected, a text will appear in the upper part of the map when the user will put the mouse pointer over an earthquake symbol. The text will contain information about the earthquake such the date and the epicentral area. |
| Scale bar | If selected, a graphical scale will be available to the user in the lower part of the map. The units of measurements are expressed in kilometers. |
|
Set the scale maximum value; after this value the scale bar will not be shown. |
| Timeline slider | If selected, a timeline slider appears to the user that let show on the map only those earthquakes within a custom time-window. |
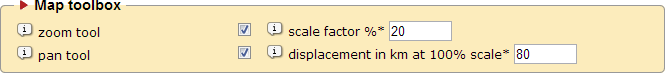
| Zoom tool | If selected, the zooming tool will be available to the user with the icon “  ” (zoom in) and “ ” (zoom in) and “  ” (zoom out) in the map frame toolbox. ” (zoom out) in the map frame toolbox. |
|
Define the scale step factor to be used with the zoom tool; the lower is this percentage, the lower will be the different scale factor between each click. |
| Pan tool | If selected, the pan tool will be available to the user with the icon “ ” in the map frame toolbox and users will be able to pan the map. ” in the map frame toolbox and users will be able to pan the map. |
|
Define the displacement steps to be used with the pan tool. |
The following settings box will let you customize the default look of the earthquakes map, in other words, how MIDOP will calculate the default map center and how big the default zoom will be.
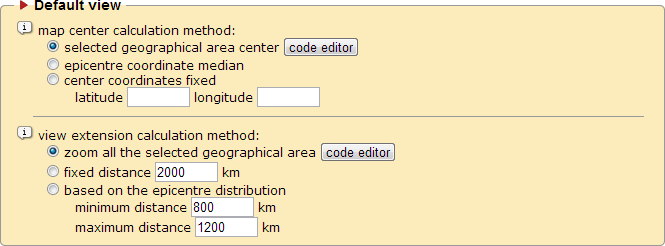
Map center calculation method:
|
Set how the default center of the map will be calculated: - by a series of pre-configured centers based on the selected geographical area (these values can be customized by clicking the button “code editor”) - by using the coordinate median of all the plotted epicentres - by using a couple of fixed coordinates |
View extension calculation method:
|
Set how the default view extension of the map will be calculated. - by a series of pre-configured zoom levels based on the selected geographical area (these values can be customized by clicking the button “code editor”) - by a specified value - by calculating the complete geographical extension of all the plotted epicentres |
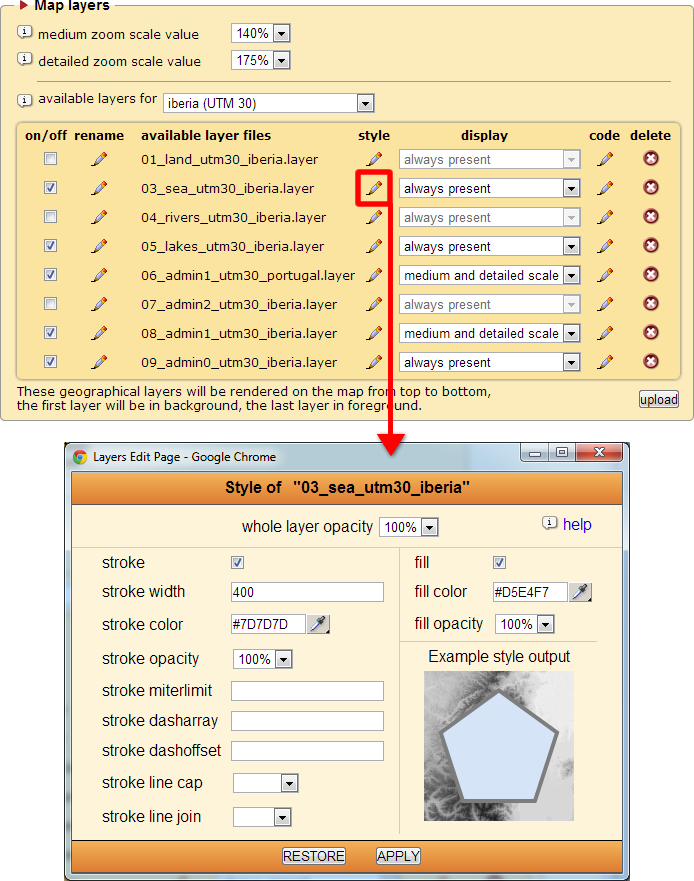
MIDOP can generate maps projected in UTM zones only.
There are built-in geographical layers (here the complete list) covering the entire globe.
Geographical laters includes:
- administrative subdivisions from GADM v2, level 0 (countries), level 1 (first level subdivision) and level 2;
- natural features, such as sea, rivers and lakes.
| Medium zoom scale value | Set the meaning of “medium” zoom in terms of zoom degree. |
| Detailed zoom scale value | Set the meaning of “detailed” zoom in terms of zoom degree. |
| Available layers for [covered area] | Manage which layers must be included with the generated maps. Built-in layers covers the following UTM zones: 28, ‘atlantic_islands’; 30, 'iberia' or 'uk'; 31, 'france'; 32, 'italy'; 33, 'eastern_europe' or “fennoscandia”; 34, 'aegean'. For further information on layers managements see chapter “Advanced customization”. |
|
turn on or off the layer when creating an earthquake map. |
|
Rename the layer file name (the extension “.layer” must be kept) |
|
Layer file name (files stored in “data / layers_eq / [UTM] / [covered area]”). The level at which the layer will be inserted when creating the map is established by alphabetical sorting the list, that’s why buil-in layers starts with a progressive number. |
|
Change the layer’s appearance style. |
|
Set when the layer will be shown: always present, shown at medium and detailed zoom, only on detailed zoom. |
|
Edit the layer source code. |
|
Delete the layer file (a requester will prevent accidental deletion). |
|
Load an additional layer file to MIDOP. Layer files are basically uncompressed plain text containing SVG objects. |
IMPORTANT NOTE
You should avoid renaming layers or deleting them. These kind of changes will affect all websites managed using MIDOP, not only the current selected one. Remember that you can disable a layer instead of deleting it, you will obtain exactly the same result, but that layer will still be available to another website.
You should avoid renaming layers or deleting them. These kind of changes will affect all websites managed using MIDOP, not only the current selected one. Remember that you can disable a layer instead of deleting it, you will obtain exactly the same result, but that layer will still be available to another website.
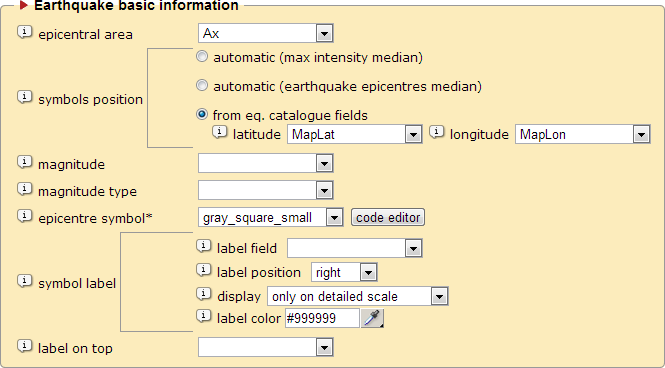
| Epicentral area | Set the epicentral area text that will appear on top of the epicentres map. |
| Symbols position | Set where MIDOP will plot symbols representing earthquakes:
|
| Magnitude | Define the earthquake magnitude value that will appear on top of the epicentres map. |
| Magnitude type | Define the magnitude type (e.g. local magnitude, moment magnitude, surface wave magnitude). |
| Epicentre symbol | Set which symbol set will be used for representing earthquakes on the map. By pressing “edit” you will be able to customize the source code of the set of symbols. |
| Symbol label | Set if and which label should appear beside the epicentre symbol. All fields contained in the catalogue table can be selected. |
| Label on top | Define the label that will appear on top of the epicentres map when the user position the cursor over the epicentre symbol; it is usually meant for representing the short study citation. |

